Buddhabrot gallery
Updated September, 2022
A collection of Buddhabrot-related images and videos that I created.
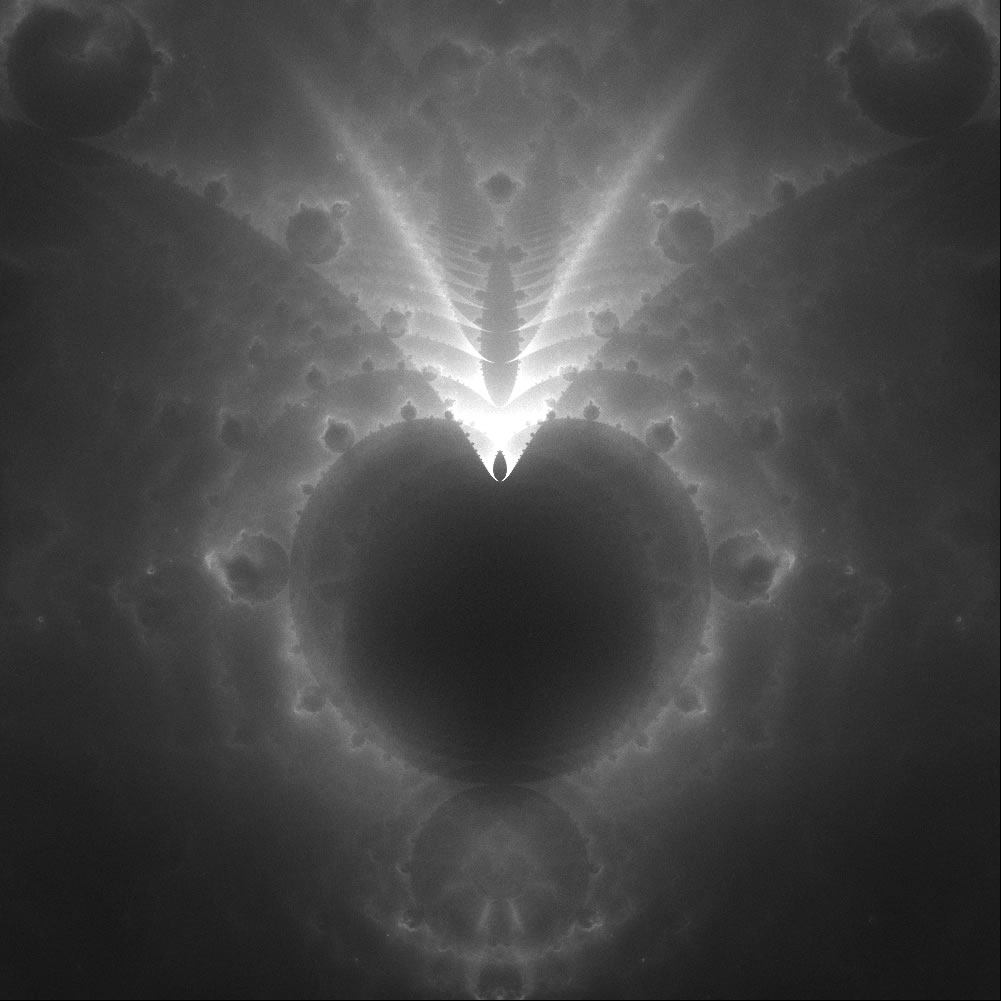
The Buddhabrot's 6 major planes.
.jpg)
.jpg)
.jpg)
.jpg)
.jpg)
.jpg)
The Mandelbrot set is contained in a circle, so it can easily be turned inside out.
.jpg)
.jpg)
.jpg)
.jpg)
.jpg)
.jpg)
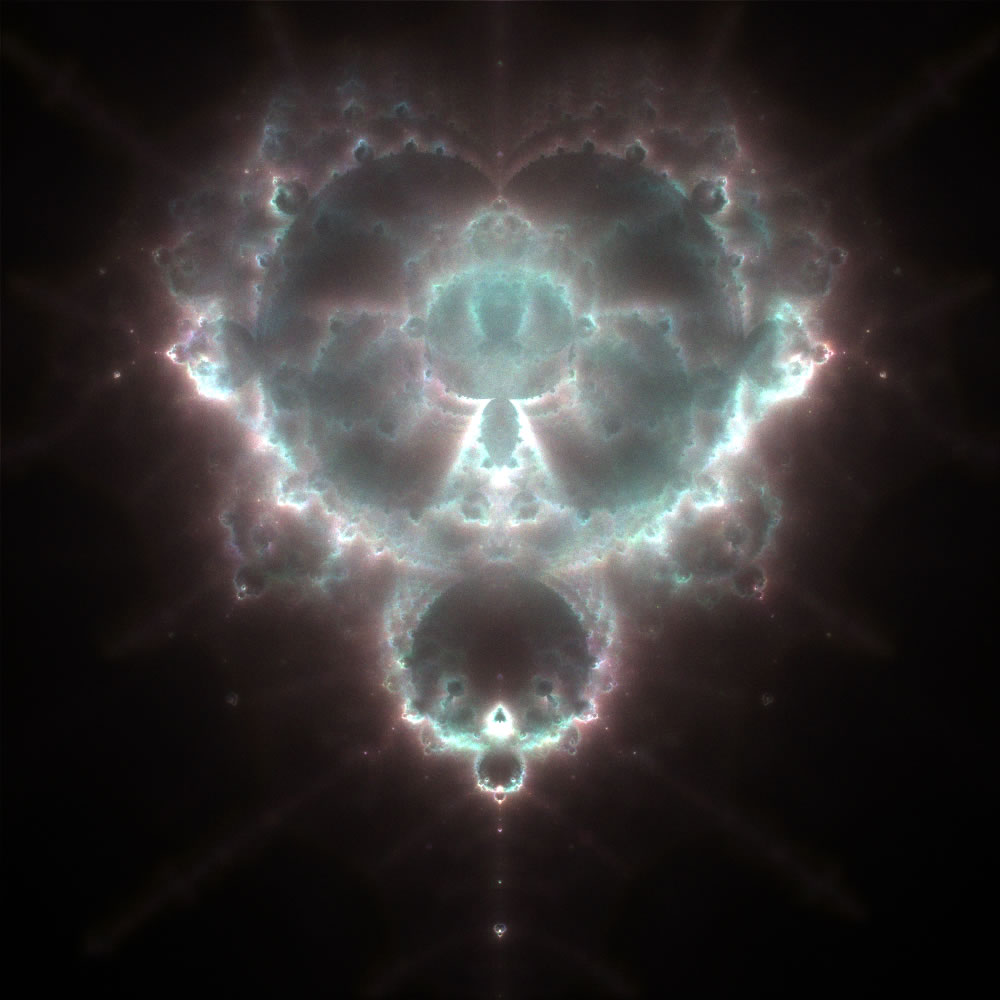
Nebulabrot render.
The Buddhabrot fits perfectly inside a 4D cube.
.jpg)
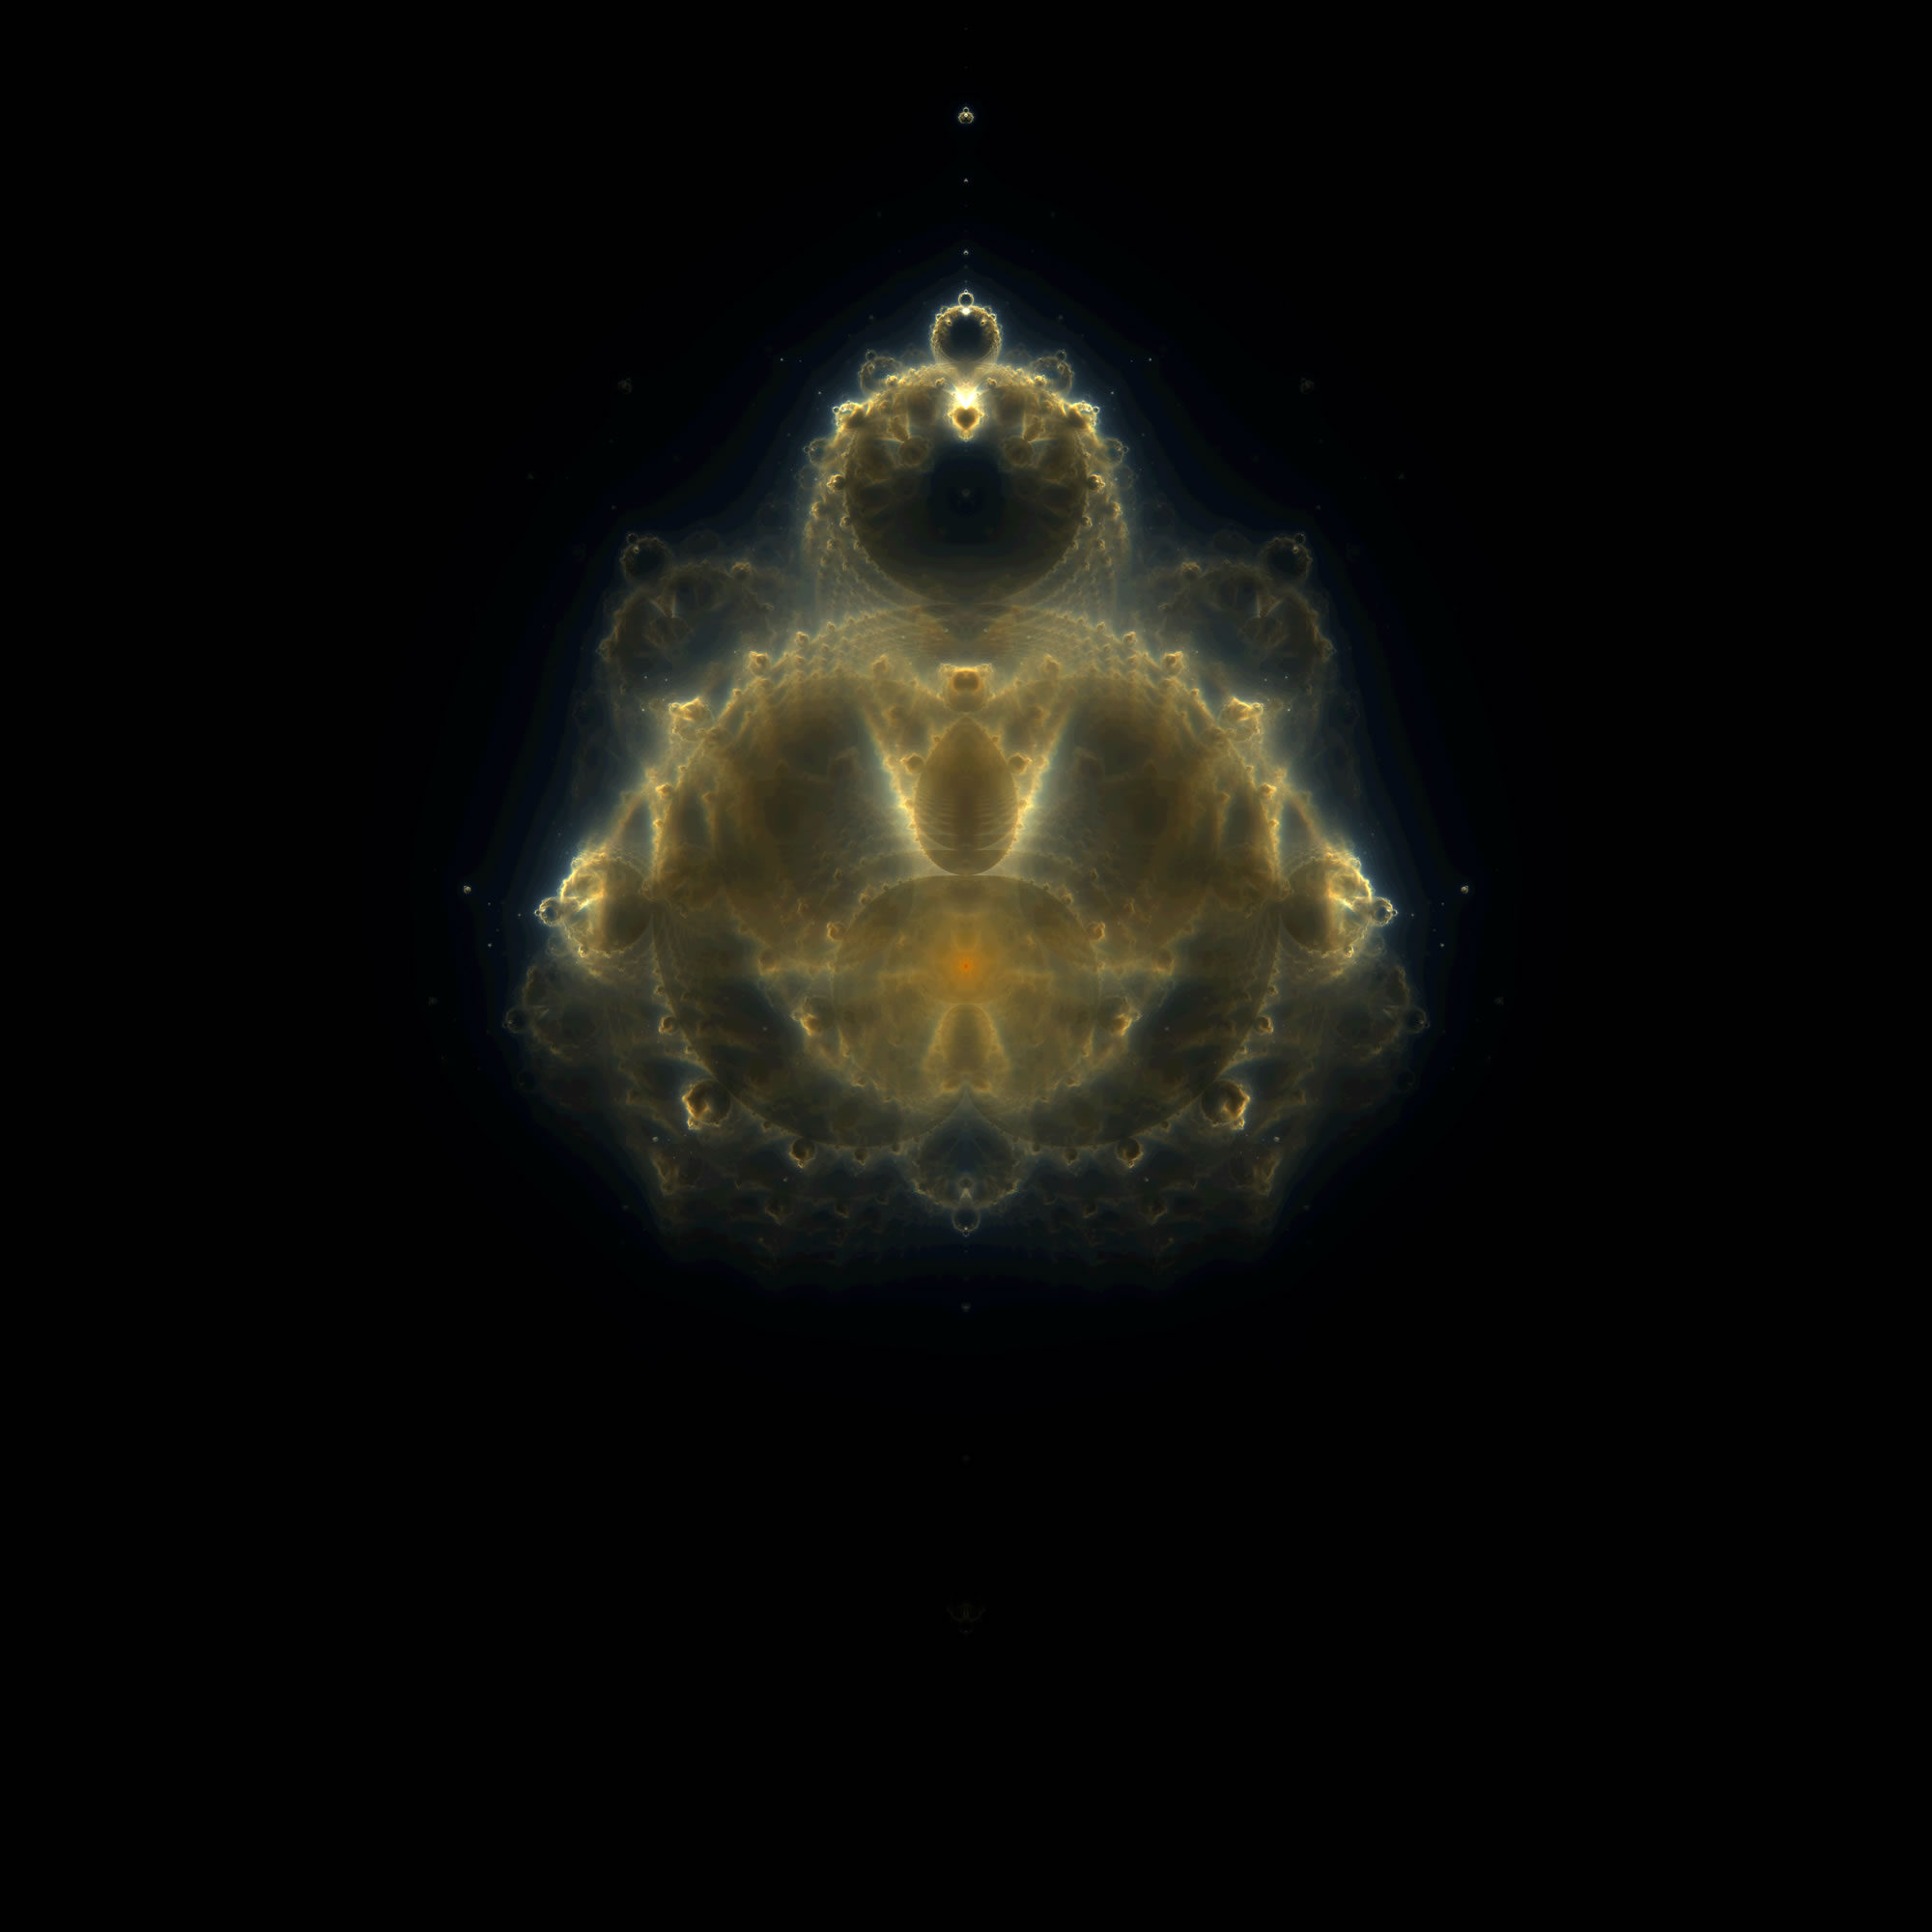
The formula used for the next image is Zn = Zn-13 + C.
).jpg)
Zooming
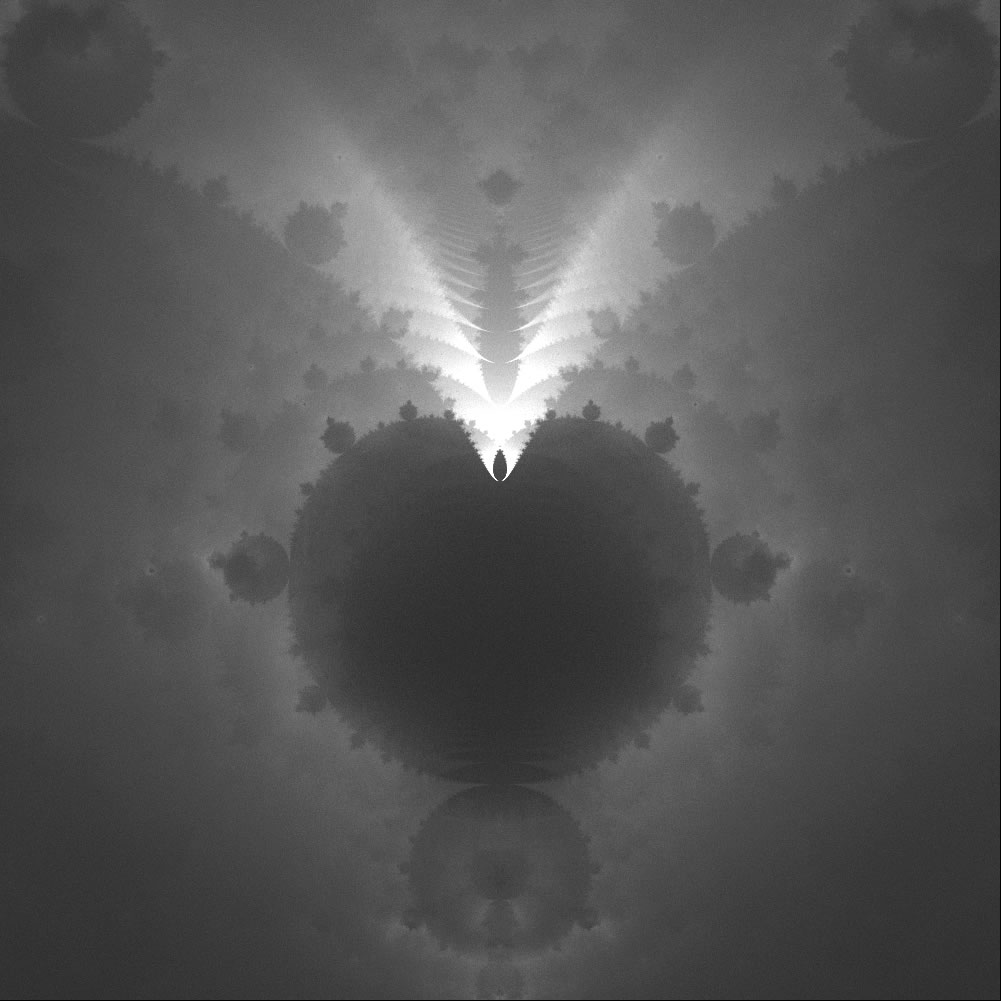
The following images are a zoom of the '3rd eye' on the Buddha's forehead. Each B&W image takes a color channel, and merging them all results in the last one. Center at (-1.15, 0i), width = 0.125.
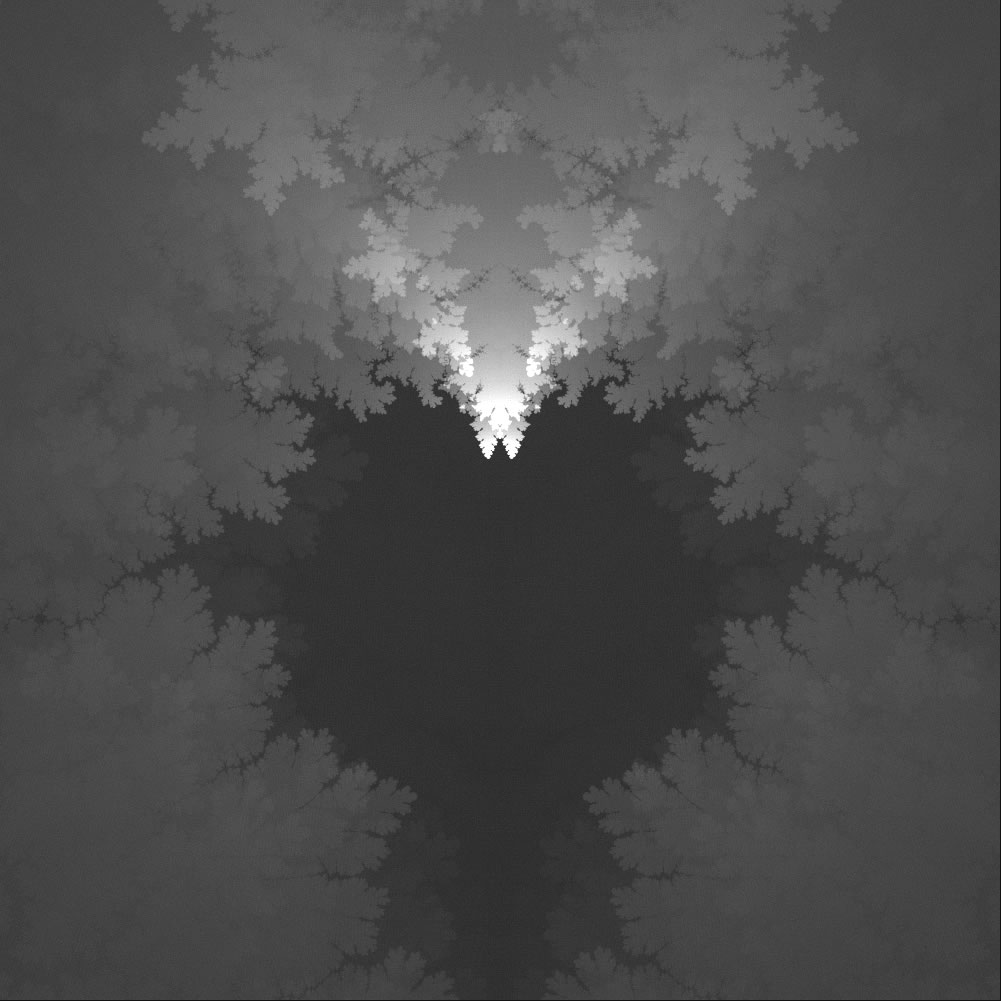

Zoom of the 3rd circumference on Buddha's head.
,L.003).jpg)
width = 0.003
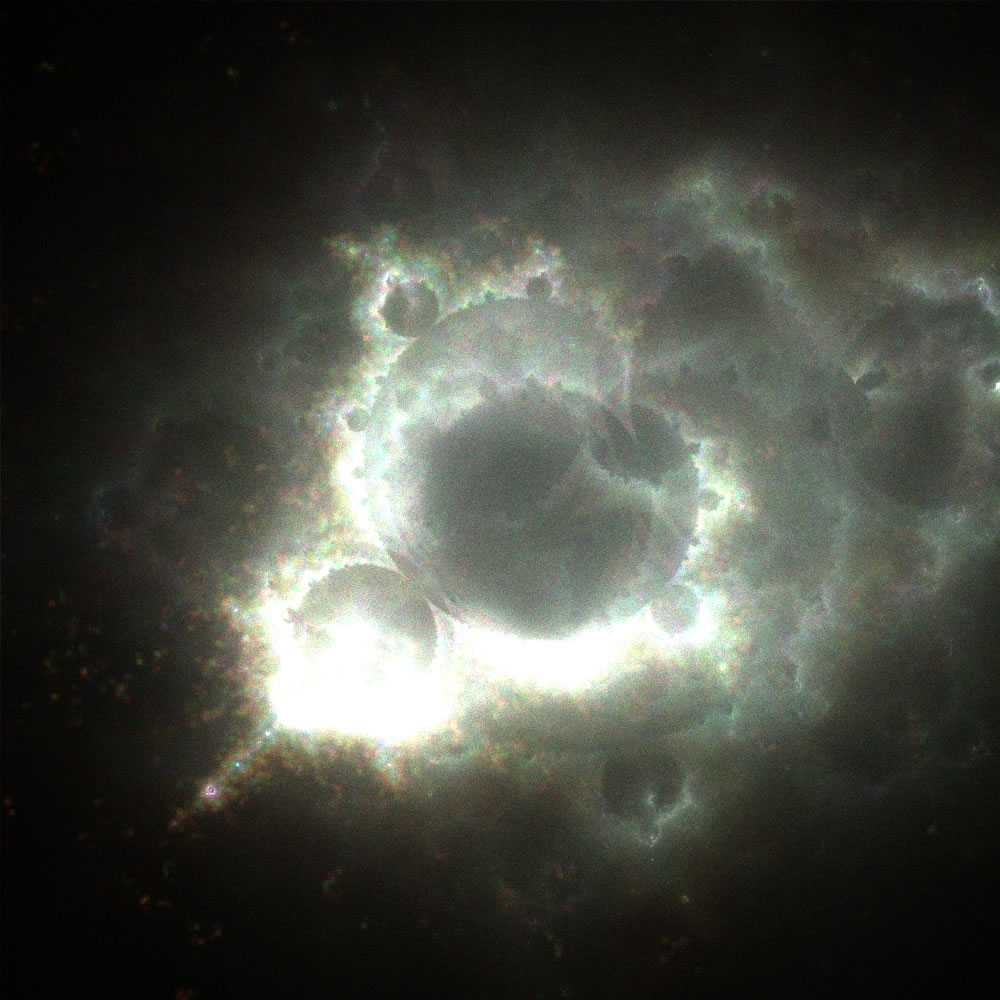
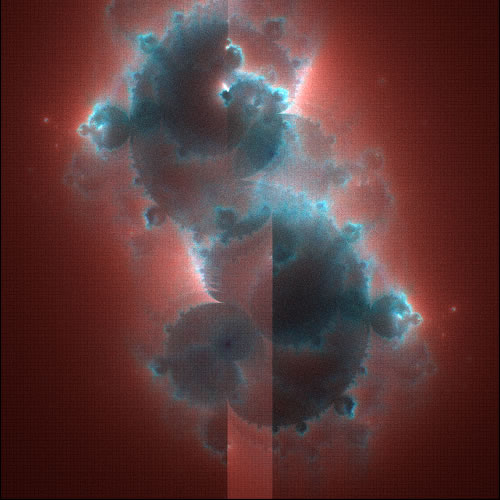
The sequence below shows a deep zoom on the floating Ghostbrots on the main figure's shoulder.
,L.05).jpg)
width = .05
,L.0008).jpg)
width = .0008
,L.000016).jpg)
width = .000016
,L.00000024).jpg)
width = .00000024
The next 2 images zoom on the Buddhabrot's center. The first image shows only orbits projected by the Minibrot centerd at (-.16, 1.035i).
,L.3).jpg)
width = .3
Minibrot orbits only
,L.3)(2).jpg)
width = .3
All orbits
More zooms.
width = 0.125
minN-maxN red = 5 - 1000
minN-maxN green = 10 - 3500
minN-maxN blue = 15 - 6000

width = 0.030476
minN-maxN red = 30 - 12000
minN-maxN green = 20 - 7000
minN-maxN blue = 10 - 2000

width = 0.018443
minN-maxN red = 0 - 15000
minN-maxN green = 0 - 10000
minN-maxN blue = 0 - 5000

width = 0.01054
minN-maxN red = 0 - 10000
minN-maxN green = 0 - 1000
minN-maxN blue = 0 - 500

width = 0.032
minN-maxN red = 20 - 10000
minN-maxN green = 20 - 15000
minN-maxN blue = 20 - 20000
width = 0.0001165
minN-maxN red = 200 - 10000
minN-maxN green = 500 - 25000
minN-maxN blue = 1000 - 50000
Animations
Rotation through the Buddhabrot's 6 major planes.
What happens as we sample more and more points on the plane? Start with 1 point per pixel, and finish with 10000.
What happens as the value of maxN increases? Start with 1, finish with 25000.
Plane sweep. Painting only trajectories that belong to points within the height 0.1 horizontal stripe.
Rotation from plane (Cr, Ci) to (Zr, Zi). This illustrates how trajectories unfold the Mandelbrot into the Buddhabrot.
Buddhagrams.
The next 3 videos show what happens when Z0 is initialized with different values.
Zr0 = 0, Zi0 increases from 0:
Zr0 increases from 0, Zi0 increases from 0:
Zr0 increases from 0, Zi0 = 0:
Negative Buddhabrot
The 6 major planes, painting only trajectories that belong to points in M.
.jpg)
.jpg)
.jpg)
.jpg)
.jpg)
.jpg)
Inverted version of the previous planes.
.jpg)
.jpg)
.jpg)
.jpg)
.jpg)
.jpg)
A couple more renders.
(2).jpg)
(3).jpg)
Primitive Buddhabrot
The 6 major planes from Linas Vepstas' original idea, colored using the Buddhabrot technique.
.jpg)
.jpg)
.jpg)
.jpg)
.jpg)
.jpg)
Mutant Buddhabrots
The images below are the product of buggy code.
Buddhabrot hologram
This rendering technique uses the Mandelbrot formula, but initializes Z0 to a random value instead of 0.
(2).jpg)
(2).jpg)
(2).jpg)
(2).jpg)
(2).jpg)
(2).jpg)
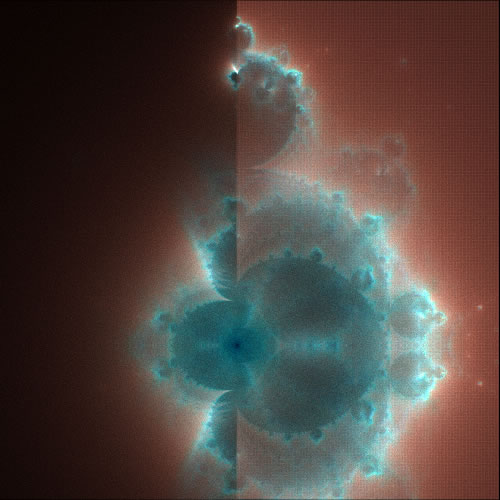
Buddhabrot hologram variations
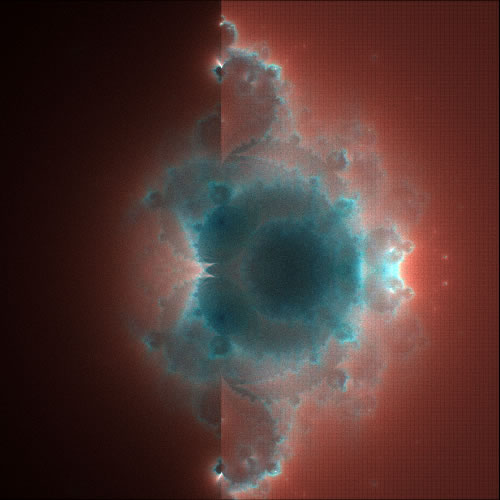
The following images result from overlaying many axial cuttings of the 4D data -in other words, several images generated with different Z0 values; in planes (Zr, Cr) and (Zi, Ci) the cuts are visible as diagonal lines.
.jpg)
.jpg)
.jpg)
.jpg)
.jpg)
.jpg)
The following images have been generated using different values for Z0:
.jpg)
.jpg)
.jpg)
.jpg)
.jpg)
.jpg)
Zi0 = sqrt(abs(Ci))
.jpg)
.jpg)
.jpg)
.jpg)
)).jpg)
.jpg)
(2).jpg)
.jpg)
.jpg)
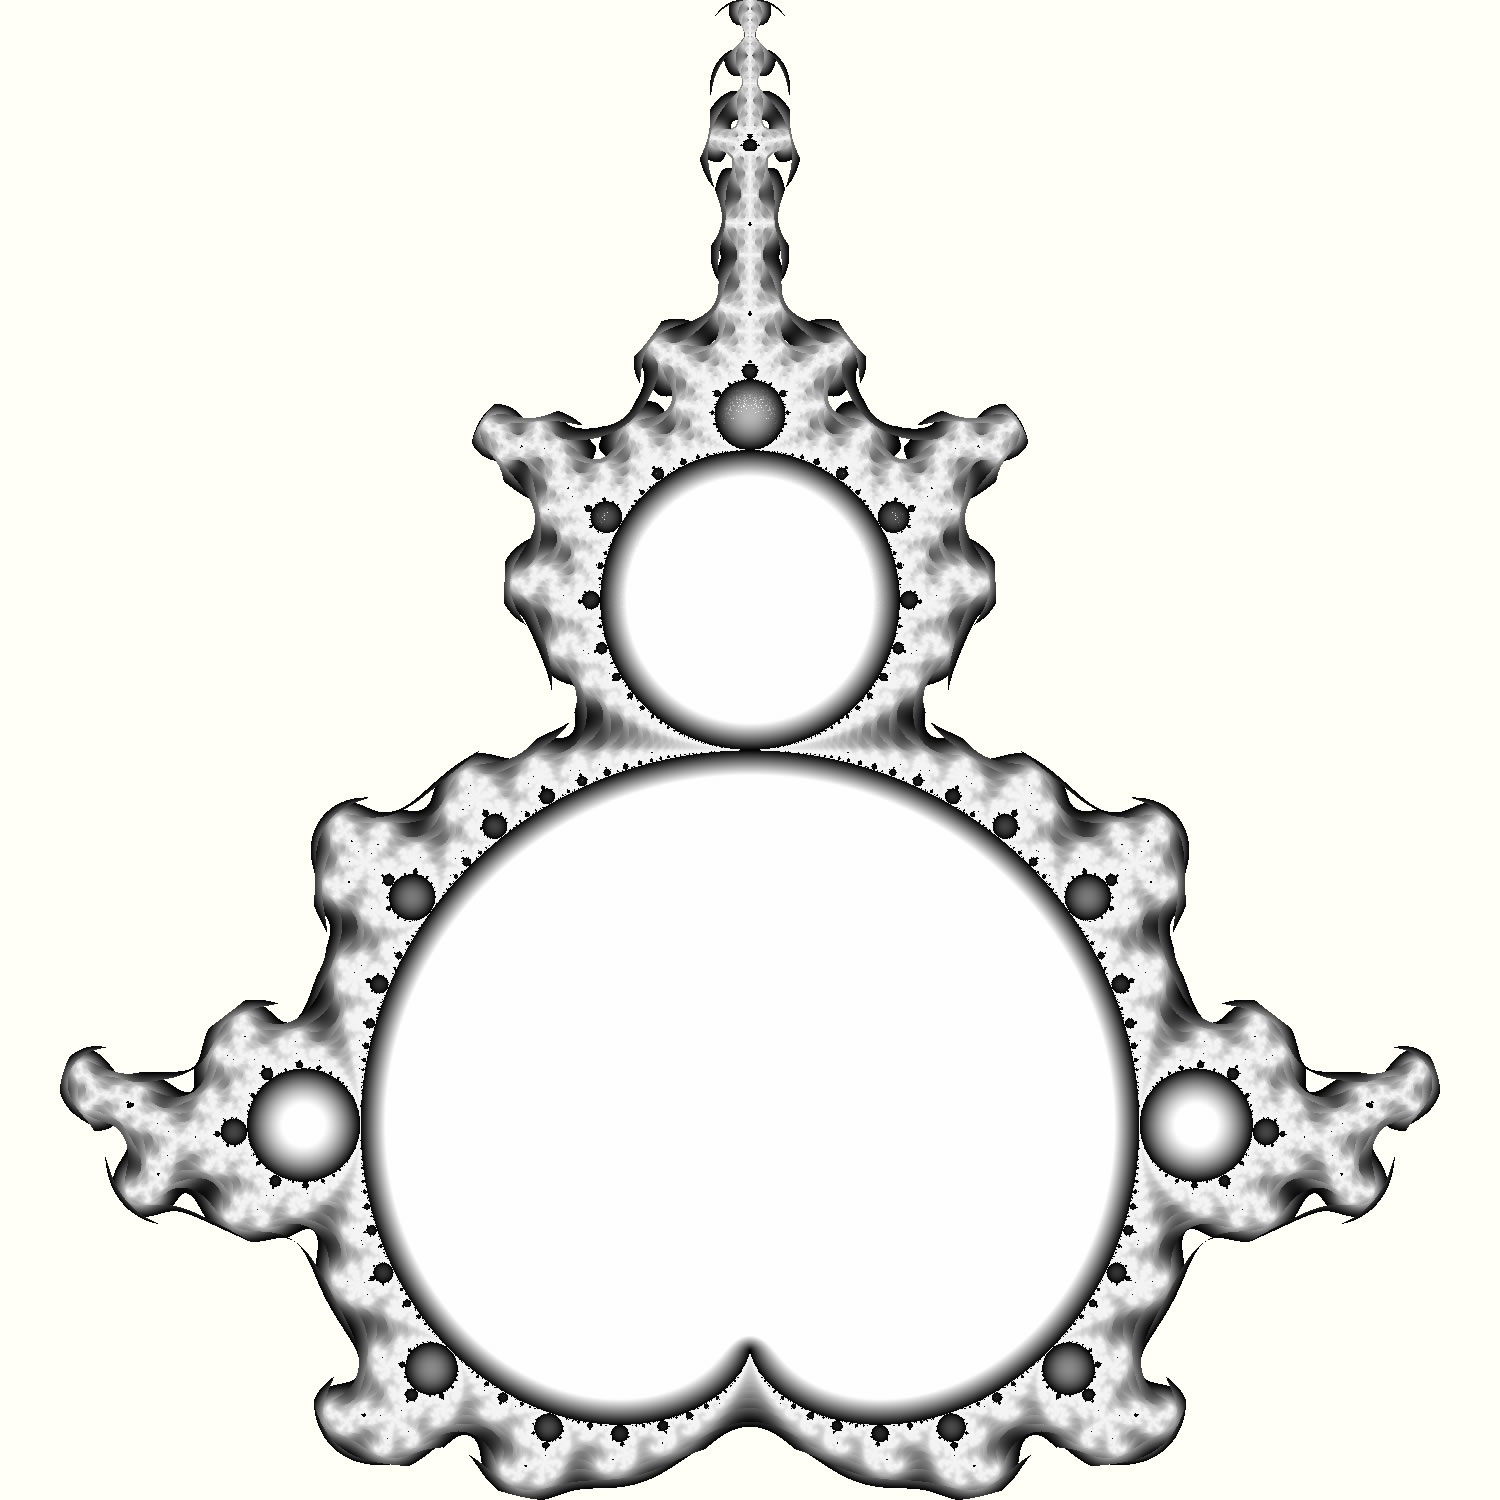
Distance estimators
The image below represents the distance from each point to the closest point in the Mandelbrot set. Values outside M go brighter as they approach the border, whereas values inside M go darker as they approach the border.